
End-to-end monitoring systems built for third-party review
Be confident in your carbon stock estimates, biomass change forecasts, biodiversity baselines, and restoration metrics. We design pipelines for our clients that are transparent, repeatable, and audit-ready.
Most projects discover the flaws in their monitoring system at exactly the wrong moment.
Registries are tightening verification standards. Methodology bodies are demanding reproducibility. Independent reviewers are finding gaps in monitoring systems that were built for internal use, not external scrutiny. The cost of discovering those gaps late — remediation, delayed verification, damaged credibility with buyers or funders — is almost always higher than building the system right the first time.
A monitoring system designed for audit isn't just about passing review. It's the foundation on which carbon stock claims, biodiversity co-benefits, and restoration progress metrics can be trusted — by a registry today and by an investor ten years from now.
How it works:
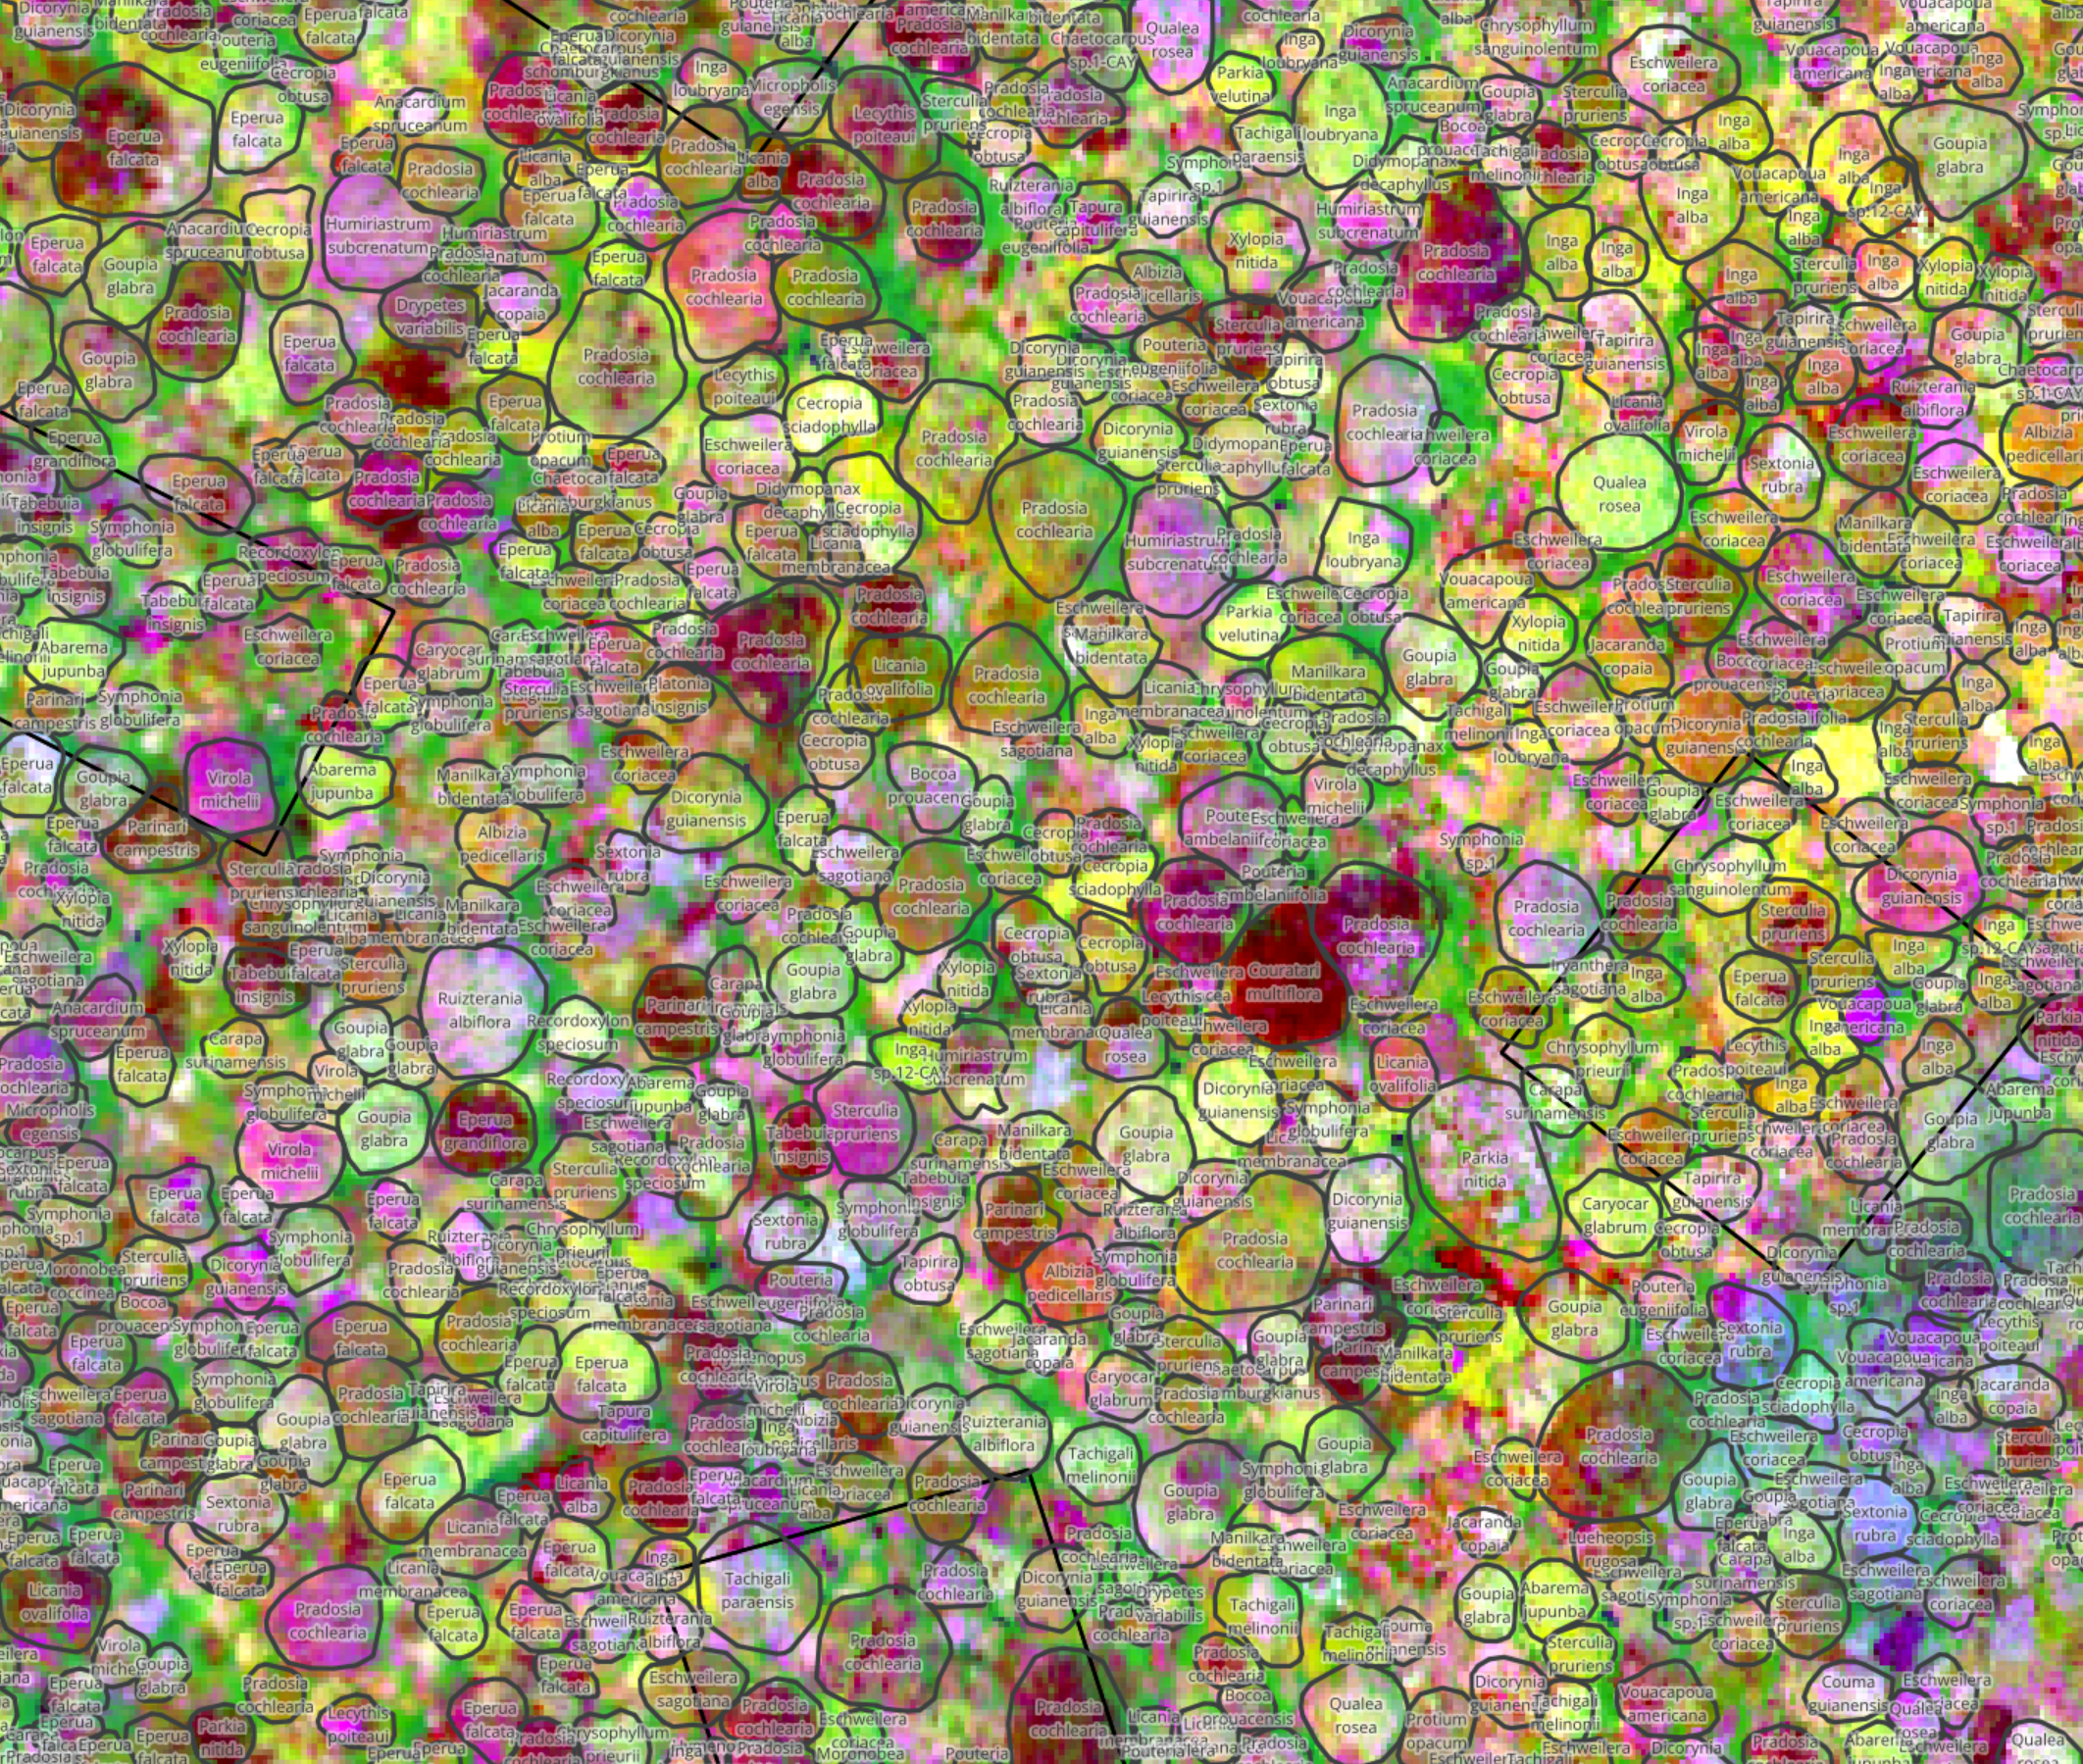
We combine high-resolution UAV imagery, hyperspectral data, and deep learning to map forests at the level of the individual tree — not the plot, not the hectare.
Species-level classification


Outputs that ground your claims
Change detection over time


We classify tree species from RGB, multispectral, and hyperspectral imagery, reaching up to 75% species accuracy in complex tropical forests - the compositional detail that turns generic forest metrics into ecological intelligence.
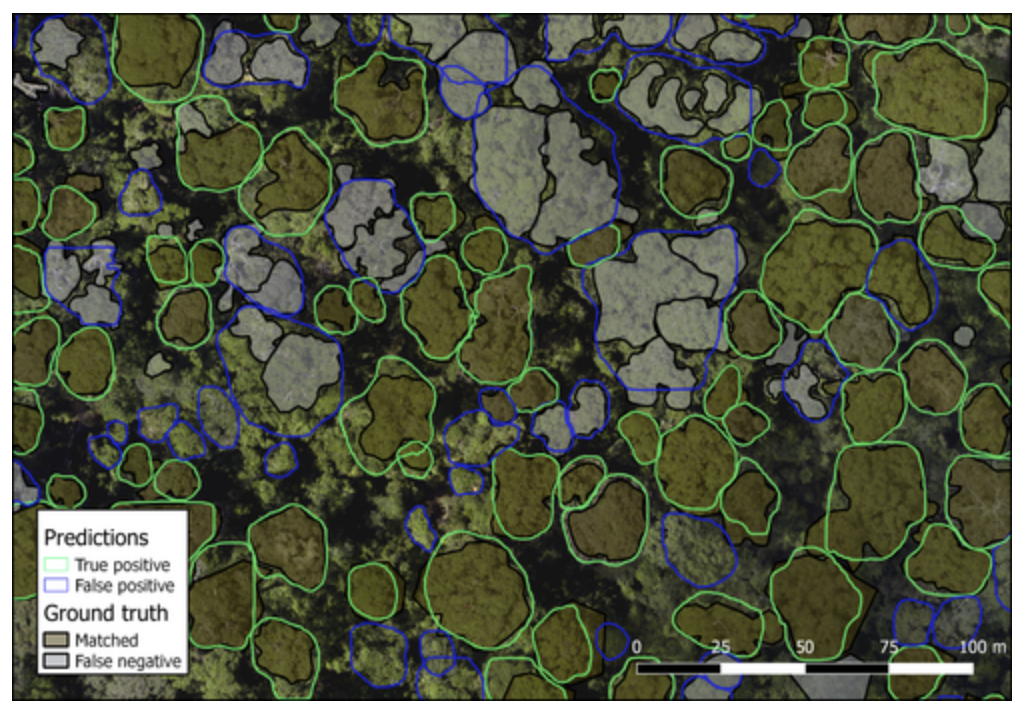
Individual tree crown delineation
We detect and outline single tree crowns from aerial, drone, and satellite imagery using detectree2, our open-source Mask R-CNN system - achieving up to 74% delineation accuracy for the tallest trees, which means reliable canopy-level inventory across your site.
Species composition maps, crown-dimension data, and canopy-structure assessments - formatted to support carbon MRV, biodiversity credits, and EUDR documentation.
Multi-temporal stacking lets us track growth, mortality, and health shifts tree by tree, improving accuracy by around 9% over single-date analysis and surfacing changes traditional methods miss.
Spicy Forest Stats
Explore interactive visualizations that uncover insights, reveal trends, and help guide smart decisions. Our charts and graphs turn numbers into narratives—helping you understand and explore key information at a glance.
-
Back carbon stock estimates with tree-level data, not plot-based extrapolation.
-
Show species-level evidence for habitat protection and funding cases.
-
Verify what's actually standing before pricing or underwriting the asset.
Built for the people safeguarding forest inventory.
Case Study
Mapping an island's trees to protect its future
To aid their conservation efforts, the Faya Foundation tasked us with developing a comprehensive tree map of Principe Island, a UNESCO Biosphere Reserve off the coast of West Africa with forest that is dense, tropical, and highly biodiverse.
Faya Foundation
Related Research
“Accurate delineation of individual tree crowns in tropical forests from aerial RGB imagery using Mask R‐CNN”
See Also:
Decision Support
Pair Inventory with forward looking risk…
Let’s discuss your forest.
Reach out to find out more about how forestmap.ai can help your organization.
info@forestmap.ai
+44 (0)7986 882 740
By submitting this form, you acknowledge our Privacy Policy.
