
Precision forest inventory,
down to the individual tree
Know exactly what species are in your forest. Get tree-level data across your entire forest — crown by crown, species by species. Using our proprietary deep learning tool detectree2, we transform aerial and drone imagery into inventory-grade maps without the time or cost of a full ground survey.
Accurate species inventory is the foundation of credible carbon accounting and conservation decisions.
Carbon stock estimates, biodiversity claims, and conservation budgets are too often built on sparse ground plots extrapolated across an entire concession. That gap is easy to overlook until a registry, investor, or auditor asks for evidence at the level of an individual tree or species, not a regional average.
Precision inventory closes that gap. Knowing exactly what's standing — every crown, every species — is the foundation for credible carbon accounting, defensible biodiversity claims, and conservation decisions that target the areas that actually need it.
How it works:
We combine high-resolution UAV imagery, hyperspectral data, and deep learning to map forests at the level of the individual tree — not the plot, not the hectare.
Species-level classification


Outputs that ground your claims
Change detection over time


We classify tree species from RGB, multispectral, and hyperspectral imagery, reaching up to 75% species accuracy in complex tropical forests - the compositional detail that turns generic forest metrics into ecological intelligence.
Individual tree crown delineation
We detect and outline single tree crowns from aerial, drone, and satellite imagery using detectree2, our open-source Mask R-CNN system - achieving up to 74% delineation accuracy for the tallest trees, which means reliable canopy-level inventory across your site.
Species composition maps, crown-dimension data, and canopy-structure assessments - formatted to support carbon MRV, biodiversity credits, and EUDR documentation.
Multi-temporal stacking lets us track growth, mortality, and health shifts tree by tree, improving accuracy by around 9% over single-date analysis and surfacing changes traditional methods miss.
Spicy Forest Stats
Explore interactive visualizations that uncover insights, reveal trends, and help guide smart decisions. Our charts and graphs turn numbers into narratives—helping you understand and explore key information at a glance.
-
Back carbon stock estimates with tree-level data, not plot-based extrapolation.
-
Show species-level evidence for habitat protection and funding cases.
-
Verify what's actually standing before pricing or underwriting the asset.
Built for the people safeguarding forest inventory.
Case Study
Biomass forecasting for next-generation carbon credits
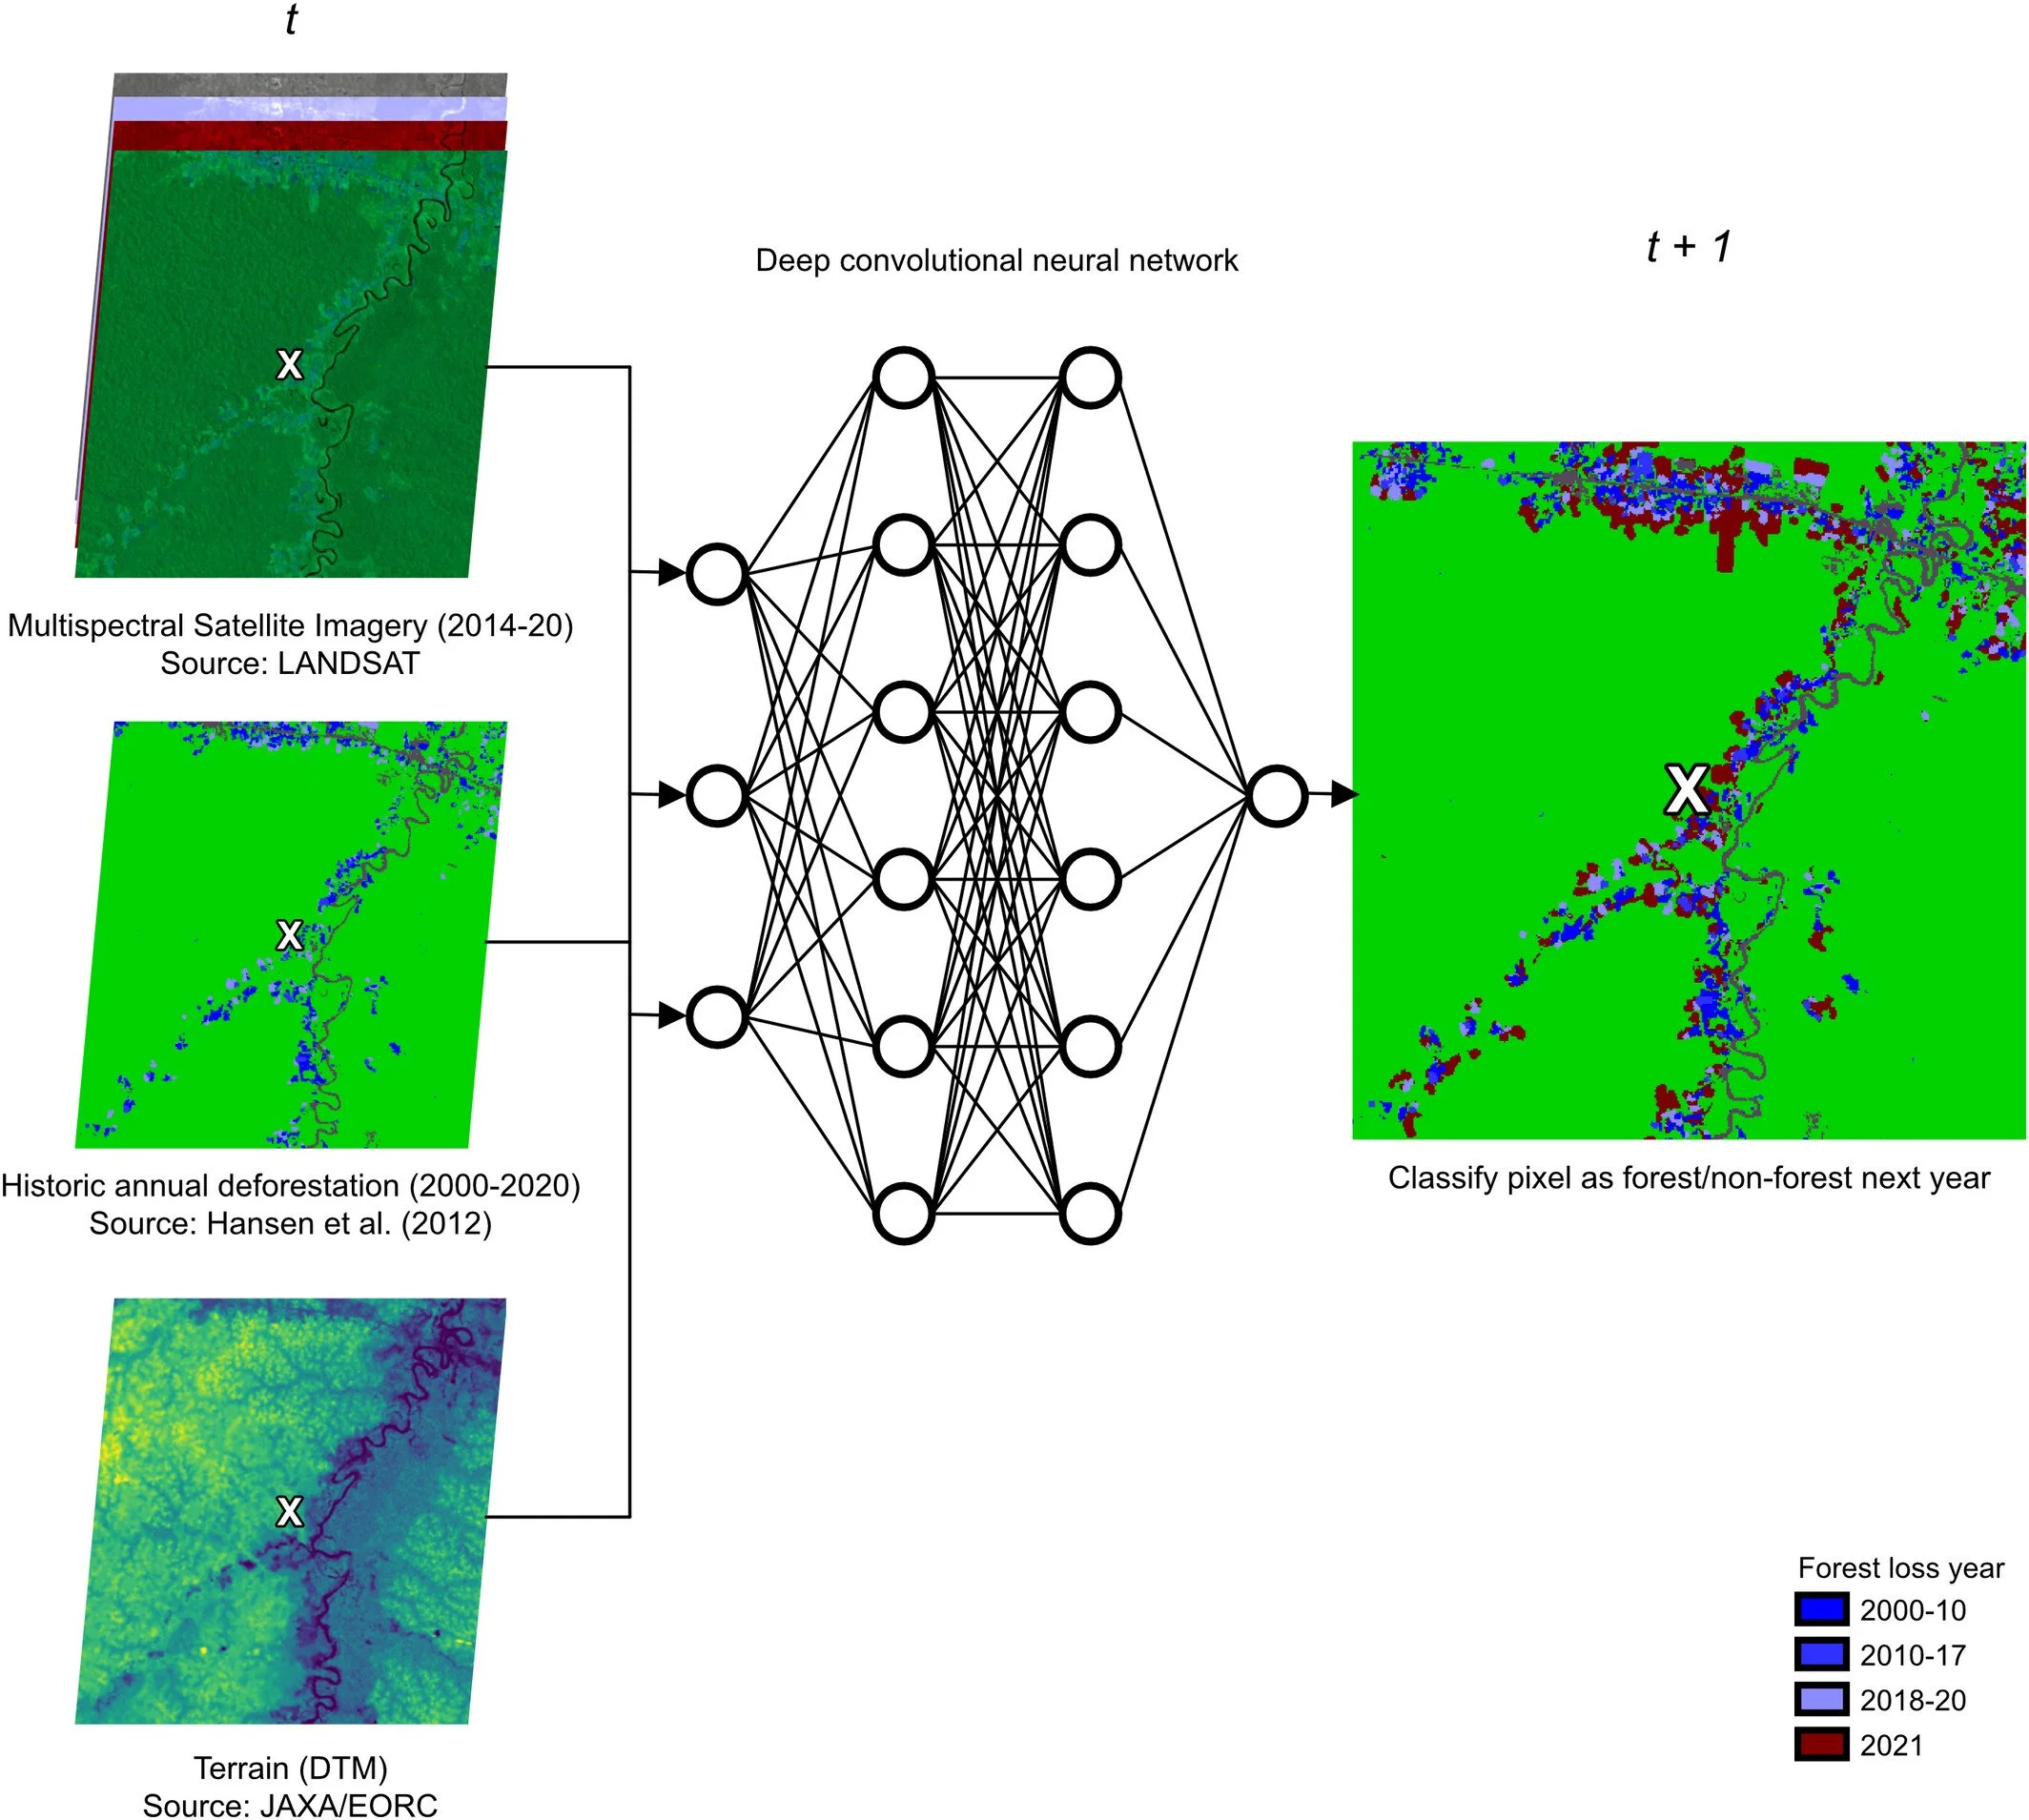
We built and deployed an AI-driven biomass forecasting system that produces pixel level (~30m) risk maps for Wildlife Works, one of the world's leading REDD+ project developers.
The forecasting system now underpins EquitableEarth's M002 Terrestrial Forest Conservation Methodology worldwide, which entered public consultation in 2025 and is being adopted by REDD+ projects.
Wildlife Works / EquitableEarth

Related Research
“Accurate delineation of individual tree crowns in tropical forests from aerial RGB imagery using Mask R‐CNN”
See Also:
Decision Support
Pair Inventory with forward looking risk…
Let’s discuss your forest.
Reach out to find out more about how forestmap.ai can help your organization.
info@forestmap.ai
+44 (0)7986 882 740
By submitting this form, you acknowledge our Privacy Policy.
