
Case Study:
Biomass forecasting for next-generation carbon credits
Sector:
Carbon markets / REDD+
Wildlife Works
Scale:
Jurisdictional (continental-scale REDD+ projects)
Service pillars:
Risk Intelligence · Decision Support
“It's been a pleasure working with such a knowledgeable and efficient team of computer vision experts. I couldn't recommend forestmap.ai more highly.”
- Jeremy Freund
CTO, Wildlife Works
The Brief:
The voluntary carbon market is under pressure to prove that credits represent real, measurable climate impact. Traditional REDD+ baseline methods - averaging historical deforestation rates across large areas - are increasingly seen as too coarse to defend under modern integrity standards. Wildlife Works, one of the world’s leading REDD+ project developers, needed a biomass forecasting system that could predict where and how much forest carbon would be lost, at pixel-level resolution, to support EquitableEarth’s new M002 methodology.
What forestmap.ai delivered:
forestmap.ai designed and built an AI-driven biomass forecasting system that:
Analyses multi-year satellite imagery and historical biomass data to learn the spatial and temporal dynamics of forest loss
Produces pixel-level (~30m) risk maps predicting where biomass loss is most likely to occur in the coming year
Supports the annual baseline allocation process required by the M002 methodology
Was designed for auditability and underwent independent review by Space Intelligence
This was not a one-off analysis. It was the construction of a production system that Wildlife Works can run and update continuously as new data becomes available.
Accurate species inventory is the foundation of credible carbon accounting and conservation decisions.
Carbon stock estimates, biodiversity claims, and conservation budgets are too often built on sparse ground plots extrapolated across an entire concession. That gap is easy to overlook, until a registry, investor, or auditor asks for evidence.
Precision inventory closes that gap. Knowing exactly what's standing — every crown, every species — is the foundation for credible carbon accounting, defensible biodiversity claims, and conservation decisions that target the areas that actually need it.
Related Research
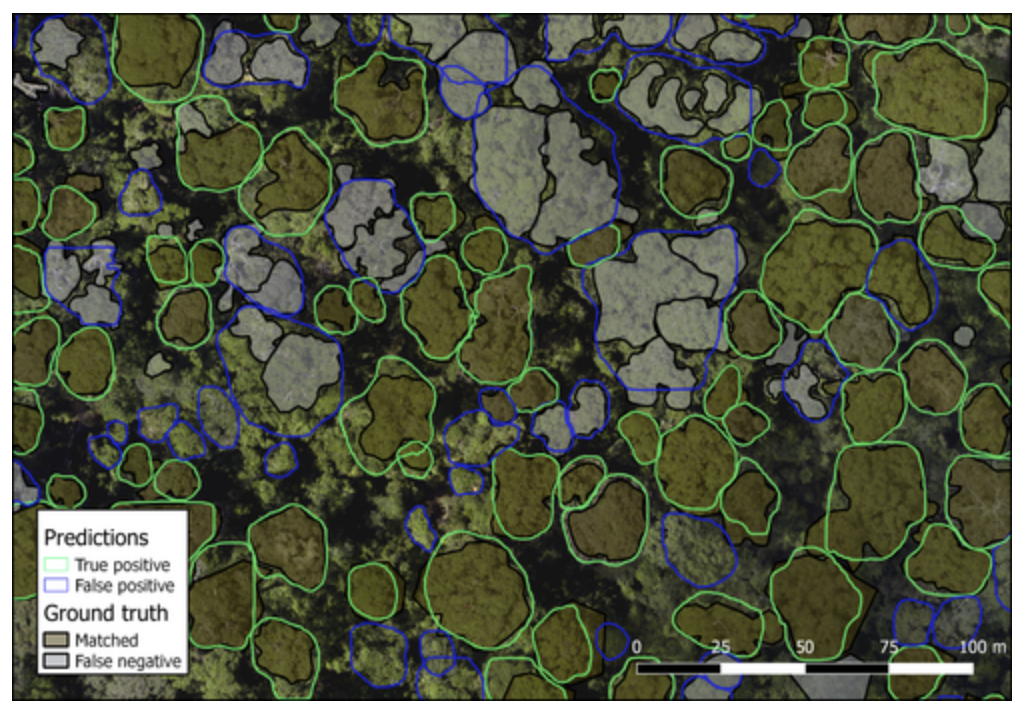
“Accurate delineation of individual tree crowns in tropical forests from aerial RGB imagery using Mask R‐CNN”
Pair species-level maps with the tools to act
Knowing exactly what's standing today is only half the picture.
[Explore Risk Intelligence →] to forecast where deforestation is likely to threaten it next.
[Explore Sensor Strategy →] to see how we design the UAV and hyperspectral data collection that makes precision inventory possible in the first place.
Let’s discuss your forest.
Reach out to find out more about how forestmap.ai can help your organization.
info@forestmap.ai
+44 (0)7986 882 740
By submitting this form, you acknowledge our Privacy Policy.
